

The Best Crypto Trades: Spotting the Real Ones
There’s a moment in the chase for the best crypto trades when the scoreboard becomes identity. Too many fixate on ROI and follower counts, proof they were right. The harder the fight for validation, the more fiercely they defend the caption. But the real discipline lives in the drawdown, the equity curve, and the quiet tools that keep emotion out of the loop. Journals and OTC desks are part of that armoury. Here is a way to read the signal before the slippage.
Learning how crypto trading actually works shows you that confidence comes from the curve, not the caption. A leaderboard number is just an outcome, a single frame from a longer film. It does not tell you how the trade was made or what risk sat behind it. I try to look past the flashy pic and see the math. The signal is often already inside the account; the challenge is making sure it gets heard.
Why ROI Alone Won’t Show the Best Crypto Trades
ROI measures the total return a trader makes over a period. Yet it conceals the how and the hazard. Leaderboards elevate ROI to a single percentage, pushing high-return names to the top. That can fool you into believing they represent the best crypto trades around. It is the Pygmalion risk in personal form: you fall in love with the statue, not the reality.
Consider two traders posting identical 120% ROI. Trader A pairs it with a 12% max drawdown, lower leverage, controlled size. Trader B pairs it with a 65% max drawdown, high leverage or concentrated positions. On paper they are twins. One sleeps; the other sweats. The label from inside the jar never shows the strain.
What ROI does not show
- The level of leverage used
- The volatility of the strategy
- The depth of losses during the trading period
- Whether returns came from a single big trade
ROI reflects the outcome, not the drivers behind it.
This matters because aggressive leverage, concentrated positions, and favourable timing can inflate returns without reflecting consistent execution. I always check the story behind the percentage before I trust it. It is hard to read the label from inside the jar.
Live Gold and Crypto Session with Broker Links
Drawdown: The Risk Behind the Return
Maximum drawdown measures the largest peak-to-trough decline in a trader’s account before recovery. It reveals how much a strategy can lose when markets turn sharp or volatility spikes. When you copy a trader, drawdown mirrors strategy volatility and risk exposure. All strategies see drawdowns; the depth decides the pain. The prison is not only in the codebase; it is in the model an individual uses to interpret risk.
ROI shows the outcome. Drawdown shows the risk taken to achieve it. I always analyse both together to see how much risk drives the reported returns. The best crypto trades are not just about gains; they are about surviving the dips without blowing up the account. It is the Long Kiss Goodnight curve avoided.
BitMEX assigns traders a risk score from 1 to 3, with 1 low and 3 high, computed from performance and risk indicators to offer a simplified view. I use it as a starting point, not a substitute for reviewing drawdown, leverage, and execution behaviour myself. The exchange has been around since 2014 and knows a bit about derivatives. Even incumbents can teach us about the edges.
Reading the Equity Curve
Metrics like ROI, drawdown, and win ratio show outcomes, but they don’t show how performance develops over time. The equity curve tracks how an account evolves and reveals patterns summary metrics miss. The shape exposes stability, behaviour during losses, and risk management under pressure. I spend more time on the curve than on the headline number. It is the jigsaw table where the picture emerges.
Three risk patterns to watch on the curve
- Vertical spike: sharp rise after flat period, often one high-leverage trade
- Artificially smooth curve: positions averaged, losses left open, risk builds
- Deep recovery curve: large drawdown then full recovery, depends on reversal
- Unstable or irregular behavior: signals weak risk control
The final ROI may appear strong, but the result depends on a single high-exposure trade or leveraged position.
After the spike, performance often flattens again, signalling low repeatability. Strategies that rely on averaging can look stable while risk accumulates as position size increases through averaging and margin use expands. When positions fail, losses exhaust margin and force liquidation. The deep recovery curve shows high tolerance for drawdown and dependence on market reversal. The safest choice is not to keep everything, but to keep purposefully.
Sharpe Ratio and Profit Factor
The Sharpe ratio measures how much return a trader generates for each unit of volatility. A higher Sharpe indicates more stable results because returns come with lower volatility relative to position exposure. It puts returns into context. A trader with moderate ROI and high Sharpe may run a steadier ship than one with high ROI and low Sharpe.
Profit factor is gross profit divided by gross loss. It shows how efficiently a strategy converts losses into gains. A value above 1 means total profits exceed total losses. But a high profit factor based on a small sample size often reflects limited data, where a few large winning trades skew results. I want these numbers backed by many trades.
Strategies with controlled volatility tend to sustain performance because lower drawdowns reduce liquidation risk and allow positions to remain open across market cycles. When I scan for the best crypto trades, I note the sample size behind the stat. A short trade history can inflate the metric and misrepresent true efficiency, so I stay cautious. The shift baseline moves quietly.
Trade Frequency and Hold Duration
Trade frequency measures how often a trader opens and closes positions. High frequency often signals scalping or intraday strategies. Low frequency typically reflects swing or trend-following. What matters is whether frequency produces enough sample size to validate performance and reflects consistent execution rather than isolated trades.
Average hold duration measures how long positions stay open. Short durations indicate scalping, medium intraday, longer swing or trend. A mismatch between stated strategy and actual hold duration signals inconsistency in execution. On derivatives platforms, hold duration affects funding payments, which impacts net returns through accumulated costs.
When you study the various types of cryptocurrency trading you should note these execution details. BitMEX shows 30d trade frequency, counting trades over the past 30 days. That helps compare consistent execution versus a few isolated trades. A trader who claims long-term trend but holds brief likely runs a different strategy in practice.
Great Bless Platform Walkthrough: Rule-Based Trading Demo
Account Age and Other Key Metrics
Account age measures how long a trader has run a strategy. Short track records often reflect a limited market phase, like a trending or low-volatility period. Longer records show how a strategy performs across trending, sideways, and volatile markets. That gives greater stability and reduces likelihood results depend on one environment.
Extra metrics to consider
- Win ratio: percent of profitable trades, not enough alone
- AUM: total capital allocated, can increase slippage if too large
- Profit sharing ratio: percent paid to trader, cuts your net return
- Leader since date: shows when copy leader started on platform
High win rates do not guarantee strong performance.
Some strategies accept frequent small losses while targeting fewer larger gains. Overall performance then depends on position sizing and risk management, not win rate alone. Higher AUM signals trust as more capital flows in, but when many accounts copy same trades, larger sizes can amplify slippage beyond available liquidity. Profit sharing directly reduces the portion of gains you keep.
Hidden Warning Signs in Trader Metrics
Performance metrics highlight results but also expose underlying risk. Some traders appear strong on leaderboard yet closer analysis reveals how results were generated. I watch for patterns that spell trouble before I copy anyone. The curse begins when the number becomes identity.
Warning signs before copying a trader
- Extremely high ROI with a short account history
- A small number of trades generate most of the return
- Repeated deep drawdowns followed by sharp recoveries
- Rapid follower growth after a short performance spike
- Equity curves showing unstable or irregular behaviour
Patterns such as high ROI, short track record, and unstable equity curves often reflect aggressive leverage, weak risk management, or performance driven by short-term market conditions.
These patterns do not guarantee failure, but they frequently lead to instability during volatility spikes or trend reversals. When multiple signals appear together, I review the strategy more closely before allocating capital. Allocating to a single strategy concentrates exposure to its drawdowns, so I prefer to spread. The Santa Rally can camouflage the rot.
Quick Checklist for Picking Master Traders
Before I put money behind a trader, I review these signals together. Consistency across them indicates strategy alignment as position sizing, risk exposure, and execution produce stable outcomes. If signals conflict, the strategy likely depends on unstable factors like high leverage or concentrated exposure. It is hard to read the label from inside the jar.
My checklist for the best crypto trades via copy
- Drawdown relative to ROI
- Account age and track record
- Trade frequency and strategy activity
- Equity curve shape and stability
- Average hold duration
- Profit sharing percentage
No fixed drawdown level applies to all. The acceptable level depends on how the strategy manages risk and whether the drawdown stays consistent with its overall behavior. I start with small allocations, monitor performance over time, and adjust exposure based on consistency and risk control. Perfection is achieved not when there is nothing more to add, but when there is nothing left to take away.
Using a Trading Journal to Find Your Edge
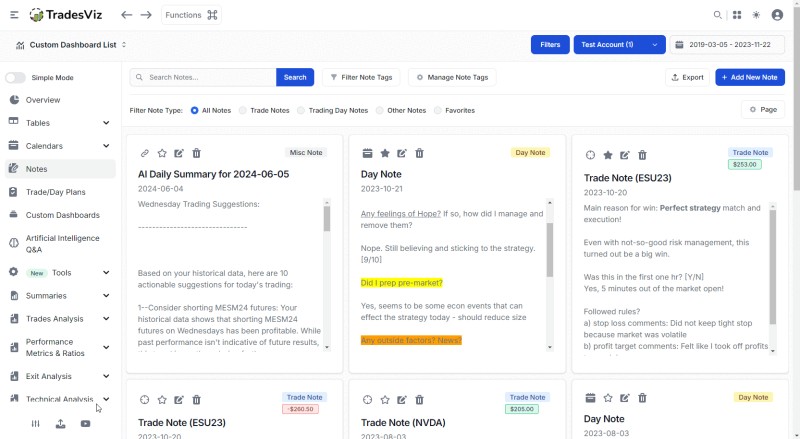
A trading journal is a quiet tool that turns guesswork into evidence. I like that some platforms auto-sync trades from major exchanges and give hundreds of charts. You can track PnL, win rate, exit analysis, and note your thoughts. It helps you see your own behavior and where your edge actually sits. The F.O.T.O. dilemma warns against keeping everything, but here purposeful logging is the antidote.
When you how to get started trading crypto a journal keeps you honest. The best crypto trades for you might show up only after you log them. Journaling is not just for pros. It is for anyone who wants to learn from real data instead of captions and follower counts.
TradesViz is one such all-in-one journal with sim and backtest, but the point is not the brand, it is the habit. Write down trades, tag mistakes, review exit analysis and running PnL. That builds confidence from your own curve, not from someone’s tweet. A dedicated notes tab matters because no automated stat replaces your own thoughts during a trade. Planned abandonment of noise is vital.
OTC Desks for Large Block Trades
If you move size, you need to avoid moving the market. OTC desks help with discreet block trades. They are trusted tools for large orders. Using an OTC desk can cut slippage versus hitting the public book. This is part of best execution in crypto and keeps emotion and noise out of the loop. Snow melts first at the edges, and so does liquidity.
In the EU, MiCA requires crypto asset service providers to take steps for best execution for clients. In the US, FINRA treats best execution as a key compliance priority, and the SEC has proposed Regulation Best Execution. The question from institutions shifted to proving best price, not just connecting to liquidity. Can you show a regulator exactly how you got filled? The label from inside the jar is hard to read.
I think about the best crypto to trade at size as a different game. You need independent benchmark, like aggregated mid-price from multiple exchanges sourced via third-party feeds. That way measurement is not biased by the same pool that filled the order. Tracking slippage versus arrival mid across order sizes shows real execution quality, not vanity fills.
Daily Profit Claims in a Crypto Day-Trading Short
Crypto Trading Strategies Explained
To keep it simple, crypto trading explained simply is this: buy, sell, or exchange coins to profit from price moves. The market runs 24/7, which gives more chances but also more challenge. A strategy is a plan with rules for entry and exit based on analysis and risk tolerance. Unlike old markets, crypto never sleeps. The puzzle outgrows the table.
Common types of cryptocurrency trading
- Arbitrage: buy on one exchange, sell on another for price diff
- Day trading: buy and sell within a single day on short moves
- Dollar-cost averaging: fixed amount at regular intervals
- HODL: buy and keep regardless of market changes
- Swing trading: hold days or weeks to catch medium moves
- Trend trading: follow prevailing market trend up or down
- Scalping: many quick trades to grab small price gaps
- Range trading: buy low end sell high end of stable range
Anybody can buy some assets on a crypto exchange, but only a few will profit from it.
Most efficient traders follow a strategy, sometimes without knowing it. The list above covers popular methods. Futures, margin, and leverage trading use borrowed funds to amplify, which raises risk sharply and can exceed initial investment. Event-driven trading reacts to news, while index investing spreads risk across assets for lower potential profit. Pick what fits your nerve and time. The peak always conceals a treacherous valley.
Chart Patterns and Technical Analysis
Some traders use chart patterns in technical analysis to find entries. Things like support and resistance, moving average crossovers, and RSI help. A a crypto trade chart can show pullbacks or breakouts. Swing trade setups stalk relative strength and bullish chart patterns to find potential buy entries.
In April 2022, one blog listed five swing trade setups like Kyber, Frax Share, Metal, Zilliqa, Near. That is an example of using charts to find potential buy entries. I am not saying those picks hold forever, but the method is clear: scan for strength and patterns, then wait for trigger. A moving average crossover gives simple buy and sell signals in trending markets.
You don’t need to be a wizard. A basic read of a crypto trade chart helps you spot real moves versus noise. RSI below 30 signals oversold, above 70 overbought, but in volatile markets it can fake you out. Combine chart reading with journaling and you get evidence, not hope. That is how I separate the best crypto trades from the traps. The signal is often already inside the organisation; here it is inside the chart.
Volatility as an Edge

Some funds trade volatility, not direction. A buy-and-hold Ethereum investor from 2021 might sit near 0% despite rallies from low to high and back, because passive exposure captured none of it. But a system trading the swings made gains. Volatility is not risk if you have the system to trade it, and that idea changed how I view drawdowns. The Gray Rhino of stagnation hides in plain sight.
Volatility isn't risk. With the right system, it's the edge.
On October 10, 2025, the heaviest one-hour crash crypto had seen happened, worse than COVID day. Most had worst day, but a volatility strategy had its most profitable day. In one February, underlying assets fell 6.2% while the strategy returned 8.6% on same assets, nearly 15% alpha from trading swings. That shows the best crypto trades can come from trading the moves rather than sitting through them. When spring comes, snow melts first at the periphery.
How to Start Investing in Crypto Safely
If you wonder how to start investing in crypto or how you can invest in cryptocurrency , start small. Use a plan, track with journal, spread across traders to reduce concentration. Don’t put all capital in one strategy or one coin. Learn the basics before size. The gentle slope is soft underfoot.
Also learn selling and buying cryptocurrency basics: you can sell and buy on different exchanges for arbitrage. That is a lower-risk method if you are fast, but fees and delays eat profit. Index investing spreads risk across assets, safer but lower potential profit. Dollar-cost averaging is simple and cuts the risk of buying at a high price.
Allocating capital to a single strategy concentrates exposure to its drawdowns and increases losses when it underperforms. Spreading across multiple traders reduces concentration risk by distributing exposure across different strategies. Start with small allocations, monitor performance over time, and adjust exposure based on consistency and risk control. That is my plain advice for finding the real ones. Not to be a grinch, but sometimes when the numbers look best, it is because the future has already been outsourced to someone else.
Finding Real Trades Without Guesswork
Leaderboards show results, but they don’t show how those results are generated or the risk involved. Metrics such as drawdown, trade frequency, account age, and the equity curve show how a strategy performs and how risk develops through leverage, position sizing, and execution. These metrics help evaluate copy traders and your own trades. The curve beats the caption.
The best crypto trades are not found by chasing captions. They are found by reading the curve, checking the drawdown, and using quiet tools like journals and OTC desks. Confidence comes from evidence, not hype. That is my field guide to spotting the real ones without guesswork, and I hope it helps you trade with eyes open. It is hard to read the label from inside the jar, but the jar can be opened.



Comments on “Finding the Best Crypto Trades Without Guesswork: A Leader’s Field Guide to the Quiet Tools”
No comments yet. Be the first to share your thoughts.